If DevOps implementation is one of the obstacles you have successfully conquered, your battle has just begun.
This is where DevOps metrics come into play.
Let me give you an example –
In 2012, the Vancouver-based gaming company Electronic Arts (EA) – known for their games like FIFA 22, MVP Baseball, NBA Street, and Star Wars Battlefront – implemented a metrics-driven DevOps process. Monitoring and analyzing data as automation runs, time logs, and customer satisfaction improved their delivery process exponentially. From zero reliability on their automation system and no priority tracking visibility, they improved their runs by 97%, producing meaningful results to their customers.
Analyzing the right metrics and KPIs gives you a clear picture of your business growth, its current performance, and things that require improvement. In this article, we list some key metrics you can utilize to monitor your Devops processes.
The Rise of DORA
The DevOps Research and Assessment (DORA) team is one of the first contributors to the research available on DevOps metrics that set the platform for further research. They were the real OG, or as we call it, Dora the Explorer for DevOps engineering, responsible for finding the critical metrics to DevOps success.
DORA’s journey as a team of research experts started in 2014 with the launch of their State of DevOps Report. The report developed a reliable way to measure the software delivery performance, investigating the capabilities that predict it, and showing how it drives business outcomes. This is the central piece of work that reports four key metrics for indicating the performance of DevOps teams, ranking them from a “low” to an “elite” status in the hierarchy.
Their years of research became the base of the book “Accelerate: The Science of Lean Software and DevOps”, authored by three of DORA’s founders. The 4 DORA metrics established that “elite” teams were twice as likely to meet their organizational goals compared to those in the middle or lower hierarchy.
What are DORA’s Four Key Metrics?
To run a successful DevOps team, data points are of critical importance. Here is a list of the four metrics that give an insight into the performance of your DevOps team.
1. Deployment Frequency
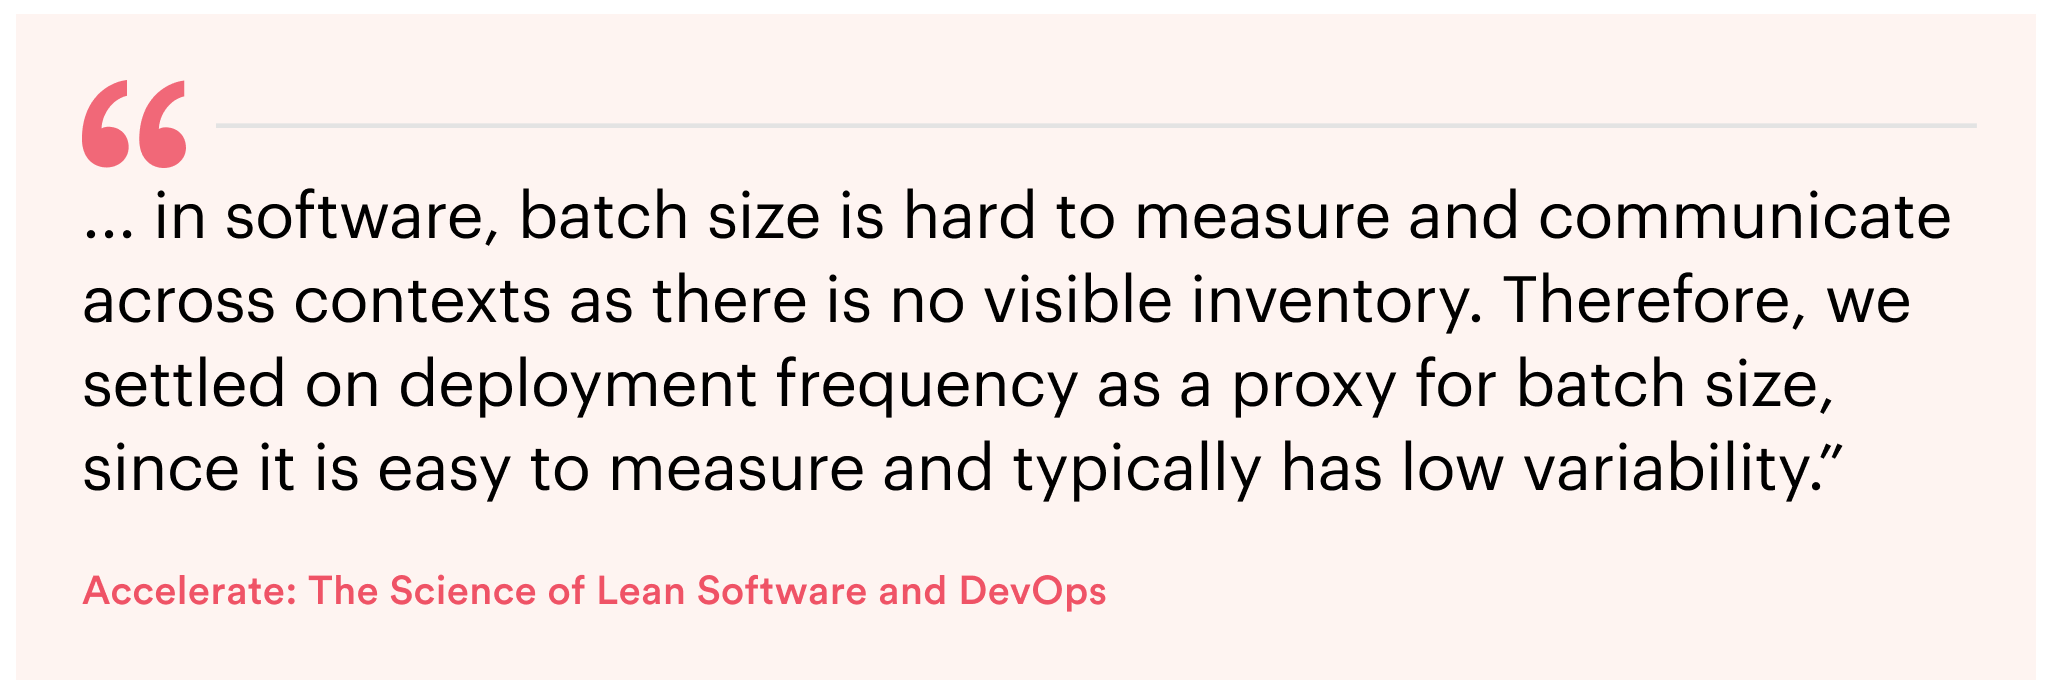
It’s one of the most basic metrics that’s easy to comprehend – your deployment frequency shows how often you deploy your codes to production. This is one metric that has a direct correlation between the quality of your engineering teams and the speed at which they function. It also reflects how much your team provides value to its codes, reacts to the feedback, and uploads the changes.

The deployment frequency can be considered as good or high when more than 50% of the months have at least one deployment. At one of the DevOps Con Berlin Conferences, engineers mentioned that companies having a deployment frequency of 13 per day are in a pretty good state. Moreover, it’s good to have small batch sizes for deployments instead of huge ones because it’s easy for engineers to manage and integrate in applications.
Measuring deployment frequency:
The best way to measure your deployment frequency is to automate the process and pick up signals from Github. You can use Pull Request flows, interpret semantic version tags, or create an API that would directly pick signals to a personalized dashboard.
2. Lead Time for Changes
Within the software development life cycle, the lead time for changes measures the time it takes for a code to move from commit to reach production. It is an indicator to check the efficiency of the development process, the complexity of the code, and the team’s capacity to react to code changes.

A higher lead time for changes indicates low team productivity and that there might be inefficiencies within the team. Within the DevOps process, this metric offers an excellent insight into how much an organization and the team have to work on reducing the delivery time.
As per Accelerate State of DevOps 2021, a team that takes an average of an hour to a week falls under the high performer category in making changes to their codes.
Measuring lead time for changes:
There is a specific formula to measure lead time for changes:

Here, the deployment timestamp is when your code is deployed into production, while the changes timestamp is when a developer checks the code in the repository.
You can get the timestamp information through Pull Request flows, interpret semantic version tags, or create an API that would directly pick signals to a personalized dashboard.
3. Change Failure Rate
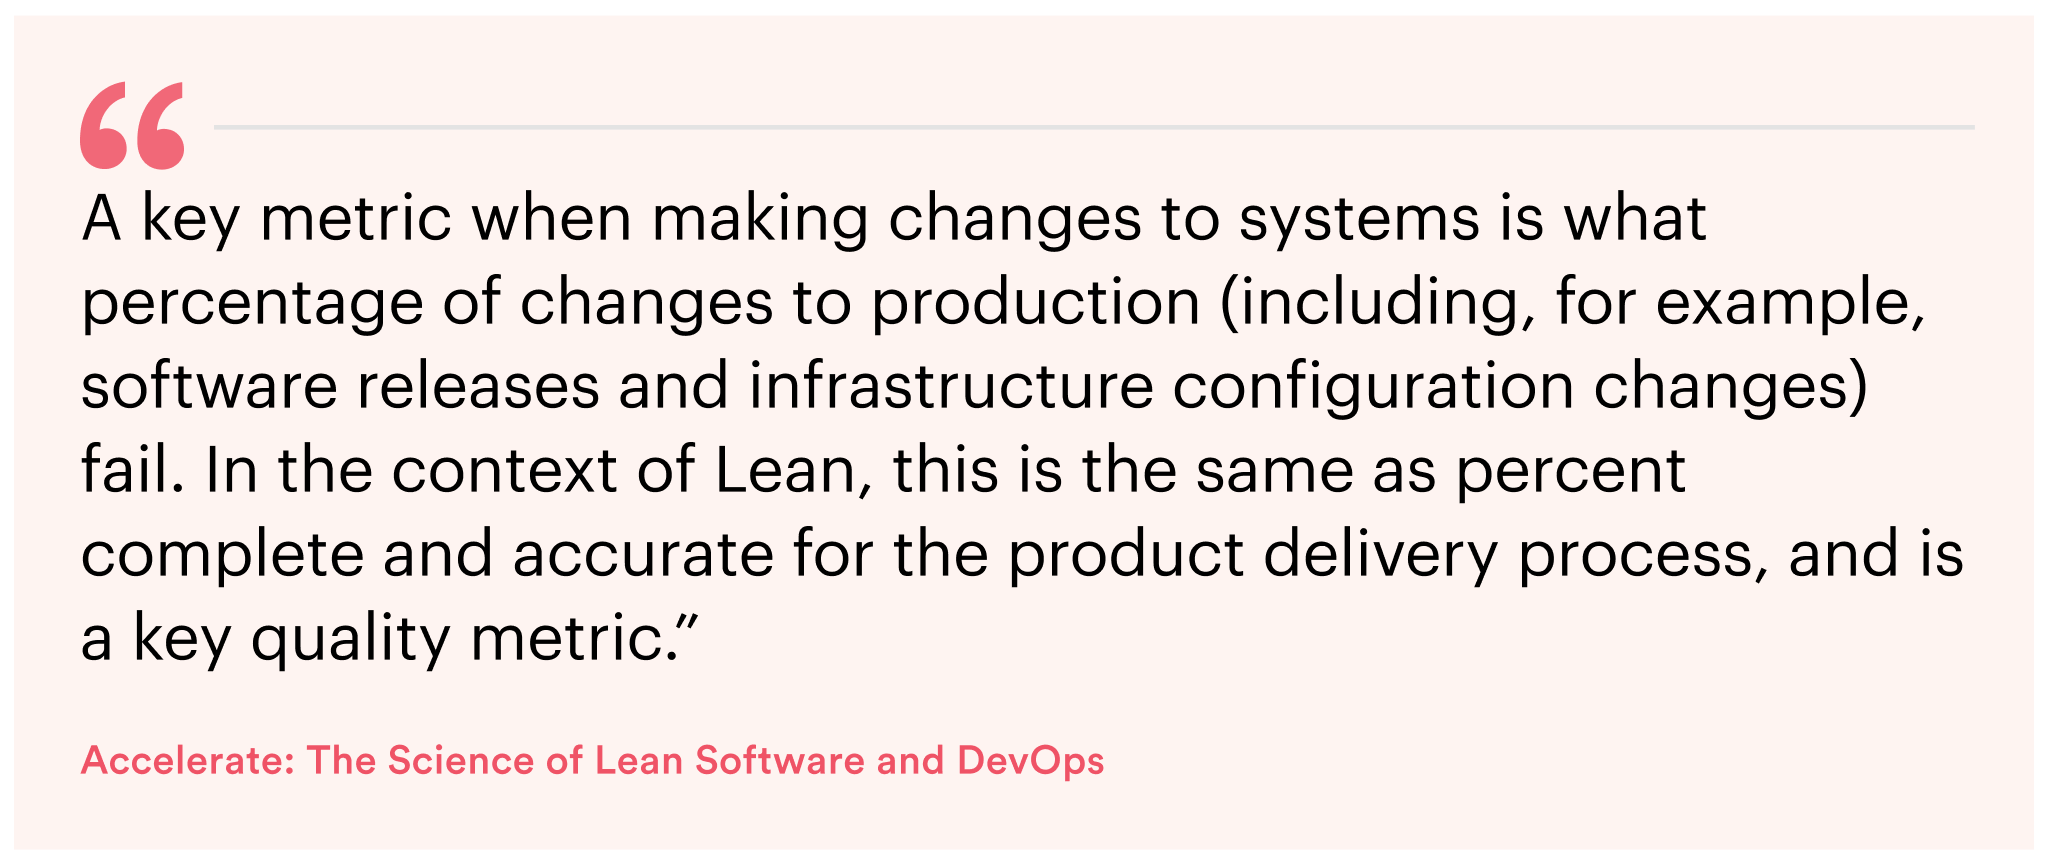
This metric measures the percentage of deployments that have caused a failure in the production and require further solutions. Hotfixes, rollbacks, and patches are a few examples of the iterations carried out by the DevOps teams to fix the problem.

The change failure rate is valuable for organizations since it analyzes how your team secures code changes and manages deployments. It also gives organizations a concrete measurement of their performance and if they have been successful in ensuring product stability and functionality.
Measuring change failure rate:
The change failure rate can be calculated using this simple formula:

This can get tricky if there is no link between a deployment and system impairment. You can detect your deployments through Github and associate incidents with failed ones. The best part is, if you are using the right tools, you can calculate the metrics per repository or service.
4. MTTR [Recovery/Repair/Respond/Restore]
The MTTR is a “one man army” responsible for collecting a number of information required during the DevOps process. This includes the rate of recovery, repair, response, and restoration.
Let’s look at each of these metrics individually and how to calculate them.
- Mean-Time-To-Repair
The average time it takes to repair a system or a product is considered mean-time-to-repair. Keep in mind that this metric does not limit itself to the repair time but also includes the time it takes to test the system until it’s completely functional.

This metric is useful for maintenance teams to keep track of repairs within the CI/CD pipeline.
- Mean-Time-To-Restore/Recovery
The average time it takes to restore or recover a product or system failure is the mean-time-to-restore. For this metric, the clock starts when a failure or outage has been reported until the system or product is completely restored to its previous state and is operational again. It is often used for assessing the speed of your overall recovery process.

- Mean-Time-To-Resolve
The average time it takes to restore a failure is considered the mean-time-to-resolve. The time includes detecting failures, diagnosing problems, repairing issues, and lastly, ensuring that the issue doesn’t arise again. DevOps experts suggest that the mean time it takes to resolve a bug is directly correlated to customer satisfaction, therefore, making it a crucial metric for unprecedented incidents.

- Mean-Time-To-Respond
The average time it takes to recover from any kind of system failure or a product failure, from the time the engineers were reported the problem is the mean-time-to-respond. While this metric keeps track of engineers’ alertness and work productivity, it does not consider any lag time within your alert system while measuring the average. The metric is useful for cybersecurity experts in quantifying the team’s success in neutralizing or tackling external system threats or attacks.

Moving beyond the DORA metrics
Research and survey have indicated that over 90% of organizations have had a direct impact on their business metrics upon adopting DevOps for their software development cycle. And the top factor that determines this success is in implementing the right tools and having the right people on the team.
While DORA provides a deep understanding and an excellent insight into the quality of a DevOps team, those four metrics cannot solve each and every problem of a complex process. I believe that it takes more than four metrics to help your team perform optimally.
Here is a list of additional metrics we recommend every organization must adopt to keep a check on their DevOps performance.
1. Defect Escape Rate
Bugs are leeches! It should not come as a surprise if you find a bug in production even after the rigorous testing process.
The defect escape rate is a metric that identifies bugs after a software feature has been deployed into production – usually during regression or acceptance testing. The calculation of this metric can be based on specific time cycles depending on the review process. It is a valuable metric to know if your test automation tools are working and if you need to slow down your testing process.
How to track Defect Escape Rate?
- Track the defects found in your software.
- Create a new work item for every defect within your Application Lifecycle Management (ALM) tool.
- Use tools like Jira, Rally, and VersionOne.
2. Customer Ticket Volume
You know you have got an engaging application if users have got a keen interest in its user experience and problems they might be facing. The success of your application is directly linked to customer satisfaction, therefore making it more important to give them the space to send feedback on challenges or user experience.
The customer ticket volume gives you an idea about the bugs or feature errors that must have bypassed the testing cycle. The metric is an important indicator of application reliability, and making the tickets based on their priority increases the chances of user satisfaction in the long run.

How to track customer ticket volume?
- Have a “Help” or “Support” feature within your application that would allow customers to report any problem.
- Keep track of issues you get through emails, DMs on social media sites, or calls.
- Tools include – HappyFox, SolarWinds Service Desk, HubSpot Ticketing Software, Zendesk Ticketing System, etc.
3. Application availability and uptime
Aiming for an application with 100% availability and uptime might not be realistic, but you can try to create an architecture that is capable of bouncing back from unpredictable downtime.
The application availability metric is the proportion of time an app is fully functional and accessible to all its users in a given period of time. While it is not ideal to expect downtime, teams often plan for it to make maintenance and create patches that can make the application foolproof against external or internal complications.

How Can You Choose the Right KPI for Your Organization?
Implementing a successful DevOps process is a dream come true, especially if it proves to be a crucial process that solves your complex application development processes. All you need to ensure is to keep the process consistent.
While the above-mentioned lists of DevOps metrics are useful KPIs, remember that every business is unique. Choose the KPI that can provide you clarity on your organizational processes. At Simform, tracking metrics is integral for the DevOps team to enable organizational agility and transparency. After all, keeping the team updated about the progress and bottlenecks always gives space for improvement and innovation.
Get in touch with our experienced DevOps experts to know more about DevOps metrics and the right KPIs you can use for your project.


