Thanks to agile methodology, the importance of measuring the overall productivity of a software team is drastically increased. Businesses are now keen on adopting software development metrics and have also started monitoring different Key Performance Indicators (KPIs) to merge quality gaps within the software product.
A software metric is a way of measuring quantifiable or countable characteristics of software. Its main aim is to determine the quality of the current product or process, plan work iterations, and identify potential improvement areas.
Read on to learn how to measure essential aspects of your software development progress. This article discusses the basics of software metrics and defines the important ones in detail.
What are software metrics?
A software metric is a standard of measure that contains several activities for estimating a software testing effort’s quality, progress, and health. For example, the UX, process, formal code, functional, test metrics, etc., can help you set clear business objectives and track software performance.
Also, the right metrics allow you to measure code complexity and productivity and streamline project management. As a result, you can understand exactly when your development team does their best work, identify project bottlenecks effectively, reduce risks and eliminate failures.
You can combine your management functions with software metrics to design impactful procedures, keep production teams informed, make effective software maintenance plans, and ultimately simplify development projects.
Why should you track software metrics?
Implementing an actionable data strategy across the entire software development life cycle is a sure-shot way to innovate and improve the software. As a product owner, you also need to look at the baseline data of your development team to experiment with existing processes and workflows.
Here are some more reasons for tracking software development metrics –
- To evaluate the quality, health, and progress of software testing
- To analyze the associated risks and flow efficiency
- To reduce frequent code changes and ensure better code stability
- To understand whether the expected software quality achieved
- To enhance team collaboration within a healthy work environment
- To plan resource allocation and reduce team workload
How to track software metrics?
Tracking software development metrics is crucial for tech leaders to gain actionable insights into their team’s performance and drive improvements. Here’s a quick look at how to track software development metrics:
- Identify specific areas you want to improve, such as productivity, quality, or delivery time. This clarity will guide your metric selection and analysis.
- Select metrics that align with your goals and provide meaningful insights. We have discussed various metrics to choose from in the latter sections.
- Integrate your code repository, project management tools, and CI/CD pipelines to gather accurate and real-time data. This minimizes manual effort and ensures data consistency.
- Establish benchmarks or targets for each metric based on historical data, industry standards, or project-specific requirements. This enables you to compare current performance against desired goals and identify areas for improvement.
- Look for trends, patterns, or significant changes in the metrics. Identify areas where performance is lacking or where improvement is needed. Regular analysis enables timely decision-making and corrective actions.
- Use retrospective meetings to reflect on the metrics and identify actionable insights. Discuss successes, challenges, and opportunities for improvement.
Examples of software metrics
There are many types of software development metrics that are widely used to track and measure various aspects of the development process.
Common examples of software metrics include developer metrics, operational metrics, test metrics, agile metrics, and more. Developer metrics are specific measurements used to assess the performance, productivity, and quality of individual developers or development teams while operational metrics focus on system performance and reliability.
In the following sections, we’ll delve into each metric category, discussing specific examples of software metrics and their importance in software development.

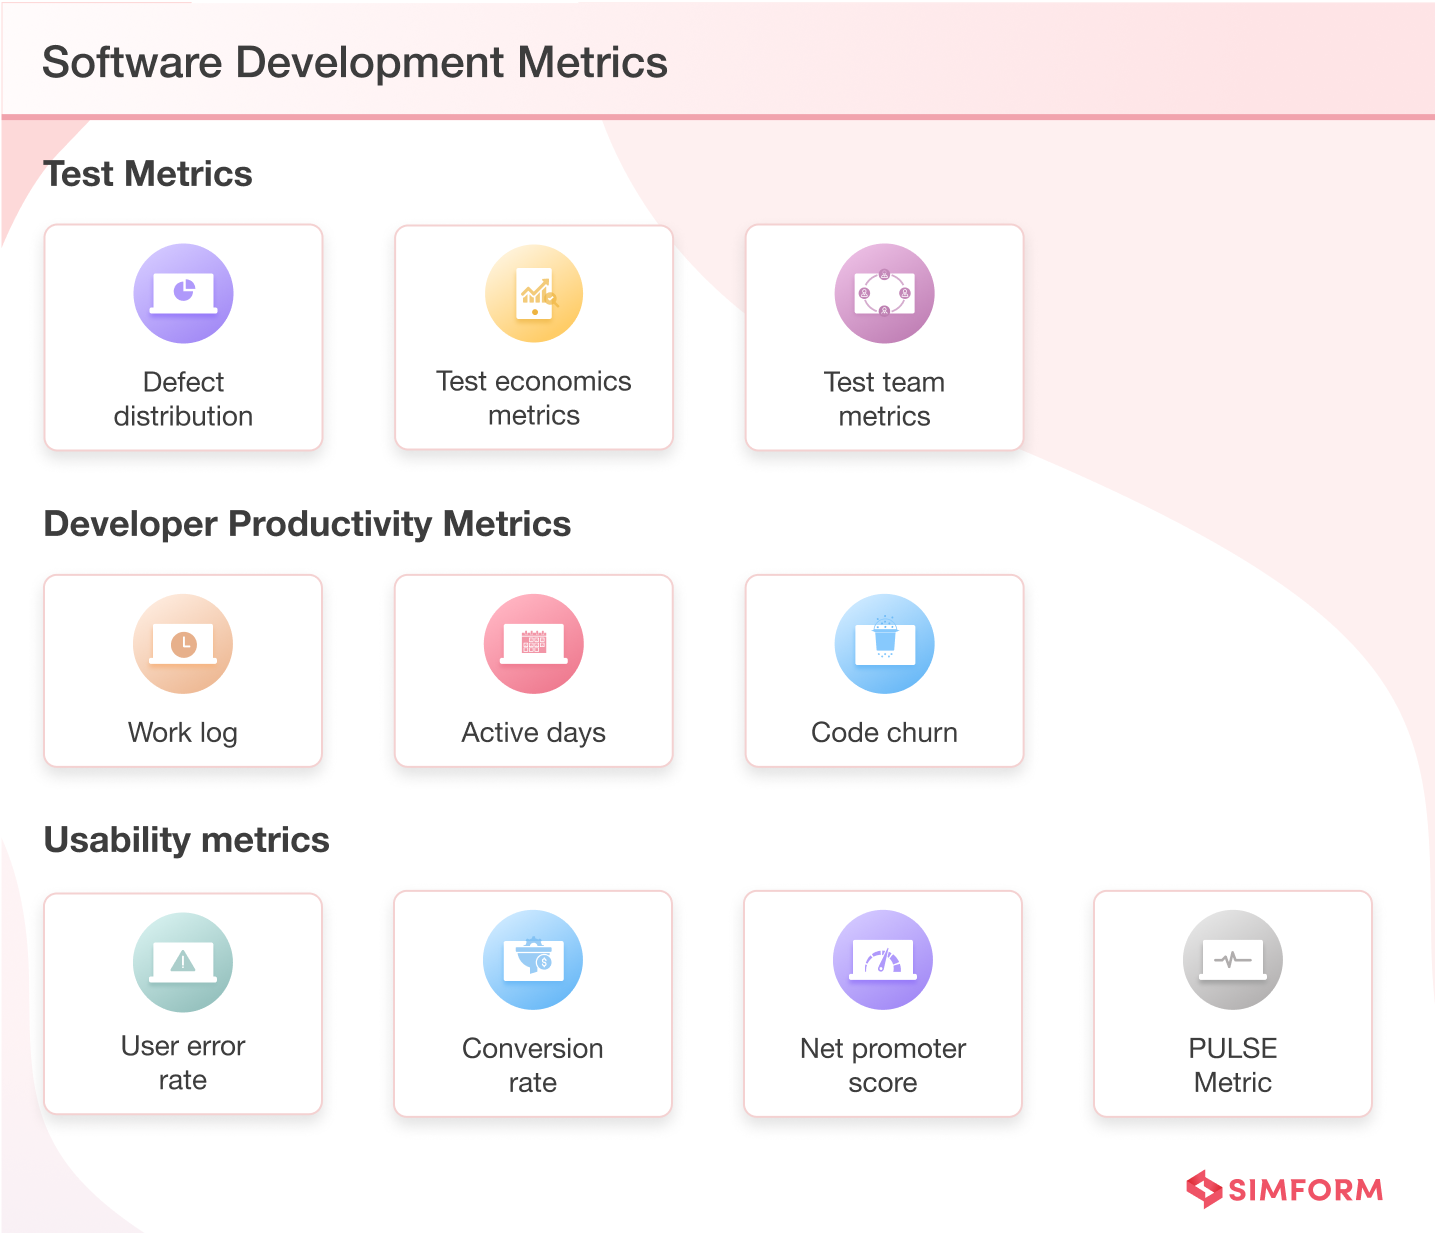
Developer Productivity Metrics
Developer productivity is the measurement of a software team’s ability to efficiently craft high-quality programs that perform well and are easy to maintain. It refers to a developer’s productivity during a specific time or criteria.
Here are some popular developer productivity metrics you can use –
1. Work log
Work log brings valuable insights based on data from code commits, open/closed PRs, merge commits, and PR comments. It helps you visualize interpersonal dynamics and work patterns. Furthermore, it facilitates increased momentum and faster delivery by helping you identify bottlenecks.
2. Active days
Active days indicate any given days when a software engineer or coder contributed the code to the development project.
3. Code churn
Code churn is a code rewritten or deleted shortly after being written. It is a metric that indicates how often a given piece of code gets edited. Code churn is inevitable when the engineer struggles to write that given piece of code, mainly due to a lack of knowledge or poor team communication.
Operational Metrics
Operational metrics are key indicators that allow you to track your business activities in real time. You can use them to improve efficiency and reflect on software development outcomes. Apart from that, operational metrics show how well a company executes its day-to-day work.
Here are some popular operational metrics to track your operational efficiency -.
1. Mean Time Between Failures (MTBF)
MTBF indicates the average time between repairable failures of software. The longer the time between unexpected outages, the more reliable the software produced. Moreover, it helps developers to understand how often incidents occur and how quickly they can resolve them.
For MTBF calculation, you should divide the total of operational hours in a day by the number of failures that occurred. Usually, MTBF is measured in hours.

For example, if the software product is operational for 1500 hours in a particular year. Over the year, there have been ten unexpected outages in that software. So here the MTBF will be –
1500 / 10 = 150 Hours
2. Mean Time to Recover (MTTR)
MTTR indicates the measurement of the meantime required to troubleshoot and repair a failed software component. It computes the duration between the start of the incident and when the system goes into production. Also, MTTR reflects how quickly an organization can react to and repair accidental breakdowns.
Here is the formula to calculate MTTR –

Let’s understand this with an example. Suppose you spent 100 unplanned hours on troubleshooting software that breaks down ten times a year. So your MTTR, in this case, will be –
100 / 10 = 10 Hours
Test Metrics
Test metrics are essential for testers, agile teams, and QA managers that want to advance their testing. The best way to enhance your testing is by choosing a relevant test statistic, setting a baseline, and then tracking your performance over the following few days, months, or years.
1. Defect distribution
Defect distribution shows which part of your software is most susceptible to defects. Here, defects can be categorized based on type, severity, root cause, module, priority, testing environment, functional area, and responsible testers.
You can use defect distribution charts to understand the distribution and identify areas for maximum defect removal. Here histograms, pie, or Pareto charts can help you track where your development efforts should go.
2. Test economics metrics
Every testing budget consists of people, time, effort, and tools. However, testing projects have limitations when it comes to resource allocation. Therefore, knowing how much you intend to spend and how much you actually spend is essential.
Schedule Variance, Cost per bug fix, Budget Variance, Schedule Variance, Cost of not testing, etc. are a few important test economics metrics that provide crucial insights into budget planning. Moreover, test economics metrics assist you in planning a budget for testing activities and evaluating the overall ROI of testing.
For example, if your budget is 10000 dollars and includes testing ten requirements, the cost of testing a single requirement will be –
10000/10 = 1000 dollars
( Here, we assume that all requirements are equally testable and complex.)
3. Test team metrics
Test team metrics measure outputs and testing work allocation. It is a way of tracking the progress of units within the development. Test team metrics include distribution of discovered defects, test cases allocated per team member, and defects returned per team member.

Usability Metrics
Imagine you’ve built robust software, and many people have signed up for it. However, they have not responded after the initial days. Or consider this, your app downloads were high after a few days of its launch, thanks to excellent marketing. But most users never bother to use it, or worse, have uninstalled the app within a week.
Deriving initial conversions are far more manageable if you integrate good promotional and marketing strategies. But keeping your users engaged and loyal to your software or app goes beyond marketing. Because here, user experience becomes a crucial factor.
You can get accurate data about the interaction of end users with your product by understanding how to measure user experience. Also, you can adjust your marketing and branding efforts to generate better results by understanding more about user experience.
Here are a few metrics that can assist you in analyzing user experience –
1. User error rate
User error rate assists you in knowing the number of times a user makes a wrong input, i.e., the number of error opportunities. The user error rate implies room for improvement within your website or software’s UI/UX design. The higher the user error rate, the higher the number of usability issues.
For instance, users often make errors while typing an email id. And without email validation, it will result in an error. Suppose ten out of every hundred users type the wrong email address; the user error rate will be –
10 / 100 * 100 = 10%
The solution would be to implement proper validation and show an error message, asking them to re-enter the password.
2. Conversion rate
The conversion rate dictates the number of new visitors that have completed different tasks like making a purchase and filling out a contact form.
For instance, if 1000 new people visit your website but only 100 out of those 1000 complete the signup process, we can derive that there’s room for improvement within your product/service offering.
3. PULSE metric
The PULSE metric is more focused on measuring the business performance of enterprise-grade software. This metric reflects technical or business aspects of the performance. The acronym PULSE stands for Page views, Uptime, Latency, Seven-day active users, and Earnings.
Let us look at what these terms exactly mean –
- Page views show the number of visitors to your website
- Uptime reflects the number of times a server is up and running
- Latency indicates your website’s infrastructure performance
- Seven-day users show the ability of your product to get repeat users within seven days
- Earnings indicate whether your product is working or not
Powerful agile metrics that can change the entire development game!
Agile metrics help you discover flaws, better understand your workflow, and speed up project delivery times so that your team can focus on satisfying customers through continuous value delivery.
The basic agile metrics are – open/close rates, throughput, code coverages, lead, and cycle time. Such metrics enable prioritizing and focusing on a particular business goal without distraction.
Agile metrics can break down the entire software project into small manageable pieces. As a result, it becomes easier for you to manage every aspect. Other than this, Agile metrics evaluate different parts of the software development process.
Below are some critical agile metrics that can help you reduce the time to turn an idea into a software product –
1. Lead and Cycle Time
Lead and cycle time are essential Agile project metrics showing how long work items are used in a particular process. Lead time shows the total time spent in the process – from when requested to when delivered. In contrast, cycle time measures the time the development team takes to work on the request.
Here is how you can calculate lead time –
Main formula: Lt = Od – Or
Here Lt stands for Lead time, Od means Order delivered date, and Or stands for Order received date
Let’s assume that a customer places an order on May 15, 2022, and then receives the order on June 5, 2021. Then the calculation of lead time is like this:
Lt = 05.15.2022 – 06.05.2021
or
Lt = 21 days, 0 months, 0 years
2. Throughput
Throughput is a metric of software development that measures the number of tasks, subtasks, features, bugs, etc., completed within a specific period. It is the measure of total work output by the entire development team. Throughput enables project managers to evaluate the work of their team members and understand their workload more clearly.
Here is the formula for calculating Throughput –
R = I / T
Here R stands for Throughput Rate, I stand for the amount of work, and T shows the Time.
Let’s see how to calculate Throughput with an example. Let’s say your software development team has delivered 144 features within 12 hours. So here the Throughput will be –
R = 144 / 12
= 12 features per hour
3. Net Promoter Score
Created by management consultant Fred Reichheld in 2003, the Net promoter score is a metric focused on customer loyalty. It determines a clear and accurate customer satisfaction rate that can be compared over different industries. In addition, the NPS assesses to what extent a respondent would recommend a specific company, product, or service to his close ones.
For instance, you have launched an MVP of your new software. Now you want to know how it is performing. So you randomly ask 200 users to rate your software between 1 to 10.
You can bifurcate the users into three types, viz. Promoters, Detractors, and Passives. Promoters are the respondents giving 9 or 10 scores. Passives are the ones who give scores of 7 or 8, while detractors are the ones giving a score of 0 to 6.
4. Code Coverage
Code coverage is one of the key agile performance metrics that can help you determine the number of lines of code validated under a test procedure. It facilitates software developers to ensure proper maintenance of code quality. Moreover, it provides developers with continuous exposure to bad code, eventually maintaining better product quality.
Here is the formula for calculating code coverage –
( Number of lines of code executed by a testing algorithm / Total number of lines of code in a system component ) * 100
Let’s get better clarity of code coverage with an example.
For instance, if your software testing consists of 200 lines of code and the number of lines of code validated is 100.
So the code coverage will be = 100 / 200 * 100 = 50%
Key software development KPIs
Software performance depends on the team’s productivity and members’ ability to complete the assigned tasks on time. Creating high-quality digital web development depends on a competent set of software development KPIs assessed correctly at different stages of a project.
KPIs or Key Performance Indicators are the values that help you measure your overall business performance, depicting how your development process is aligned with your business goals.
Here are the top KPIs for software development –
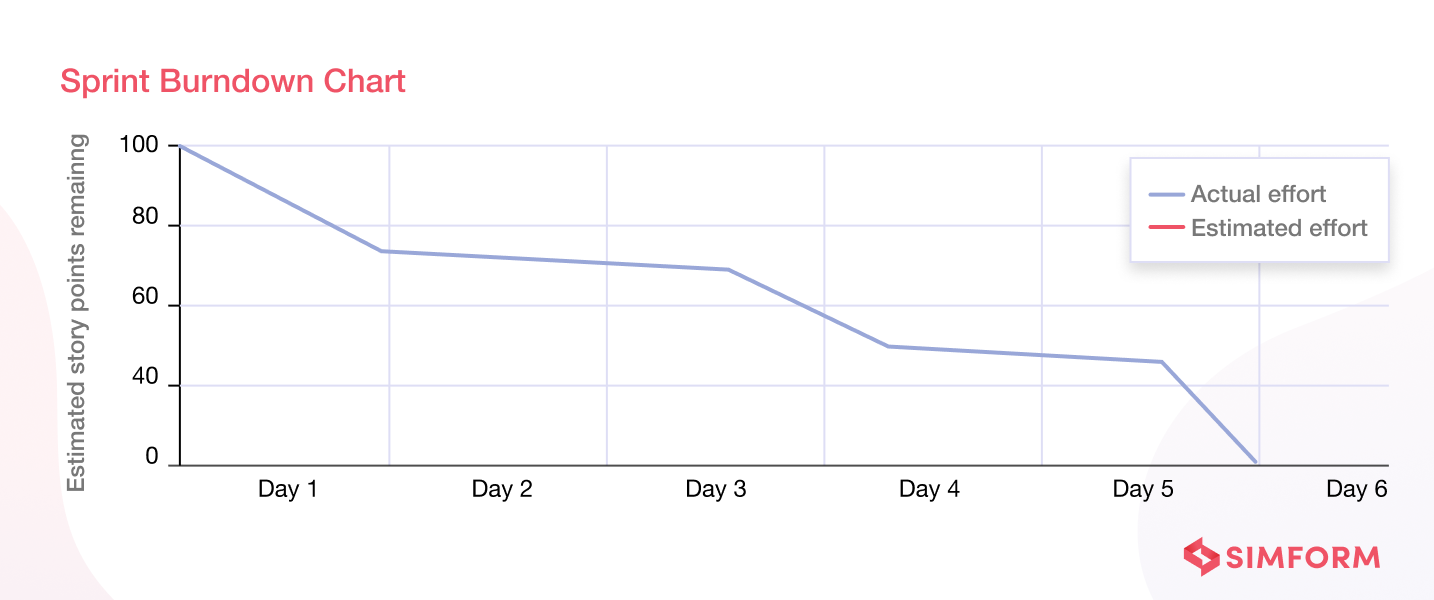
1. Sprint burndown chart
Sprint burndown is one of the prominent measurement metrics used by scrum teams to manage their development process. It offers a graphical representation that dictates the project progress within the prescribed time and the amount of work completed during each iteration.

Here is how you can create an accurate sprint burndown chart –
- Create a work management baseline to compare actual and planned tasks
- Complete a gap analysis based on inconsistencies
- Collect information for future sprint meetings
- Reallocate resources to complete sprint tasks in time
Overall, the sprint burndown chart lets you access up-to-date reports on project progress.
2. Velocity
Velocity shows the amount of work completed by a team during the sprint. There are different ways to measure the rate; the popular one is story points. The story point method evaluates the size of a software development product and the time to build it.
Regardless of your project size, you need three sprints to understand how fast your team can complete it. Moreover, velocity can also help you estimate approximate development costs in advance.
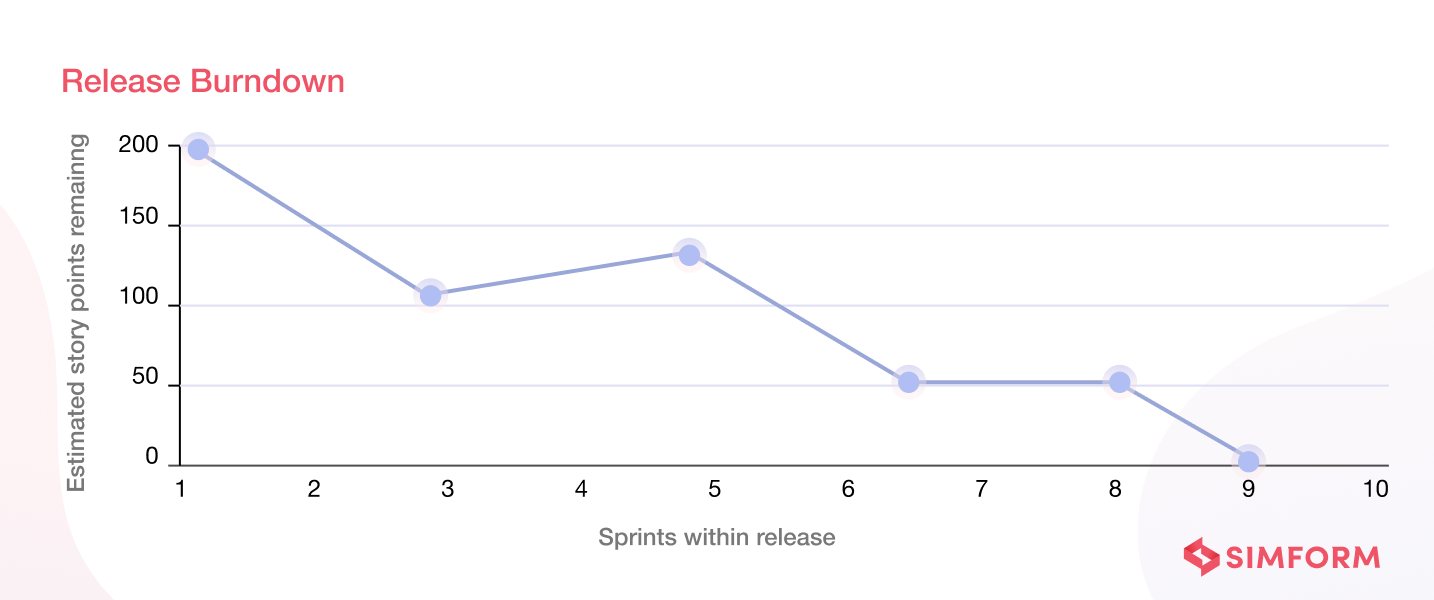
3. Release Burndown
Release burndown is a critical KPI for software developers that notes the entire release progress. In addition, this metric can assist team leads in guiding their members in managing the release of the final product. In release burndown charts, the x-axis shows sprints while the y-axis represents story points.

You can utilize a release burndown chart to ascertain whether you are working as per schedule. In addition, you can have accurate data on hand to show stakeholders when they can expect an ROI post-release. Likewise, you can update enthusiastic customers about delays or early releases.
Aim for progressive software development with Simform!
Software engineering teams constantly look for ways to improve their processes and delivery. And without software development metrics, teams lack an objective, meaningful way to measure performance.
The software development metrics mentioned in this blog can help you enhance your customer experience, track the progress of the development, indicate your team’s performance, reduce technical debt, and reveal important clues about the organization’s overall health.
Experts at Simform will study the entire process and help you set the correct KPIs will derive the best outcome. Our team has hands-on experience in tracking and optimizing development processes. Sign up for a free consultation with our software experts today!
