In just 4 years, a whopping 6 billion users – that’s half of the world’s population, will be active on social media. And if you’re curious to know the time we spend on social media, it is jaw-dropping 147 minutes daily.
Any place where people spend so much time of their day is important from a business perspective. Many businesses realize this and invest heavily in analyzing data from social media. In most cases, businesses are concerned about the sentiments on social media regarding their brand. It helps them gain insights into the kind of sentiments that social media users have regarding their brand.
In this blog, we will look at how you, as a business, can benefit from social media sentiment analytics by building a data engineering pipeline for social media data. But first, let’s look at how social media listening can benefit a business.
How can social media listening help your business?
Your prospective customers actively discuss your brand and sector on social media. With social listening, you can discover what your customers are saying and identify new opportunities.
Social media listening helps unlocks valuable insights and improve business strategy.
Here’s how:
Understand your audience better
You may better grasp the needs of your brand’s audience by using social media listening.
For instance, a current client could tweet about how much they enjoy your product. Or you could hear someone talking about a problem that your product or service might solve.
You can utilize these insights to enhance your product and customer satisfaction.
Spotify has a Twitter account, SpotifyCares, to listen to their customers and address their queries.
It also provides its followers with daily tips, techniques, and feature updates.
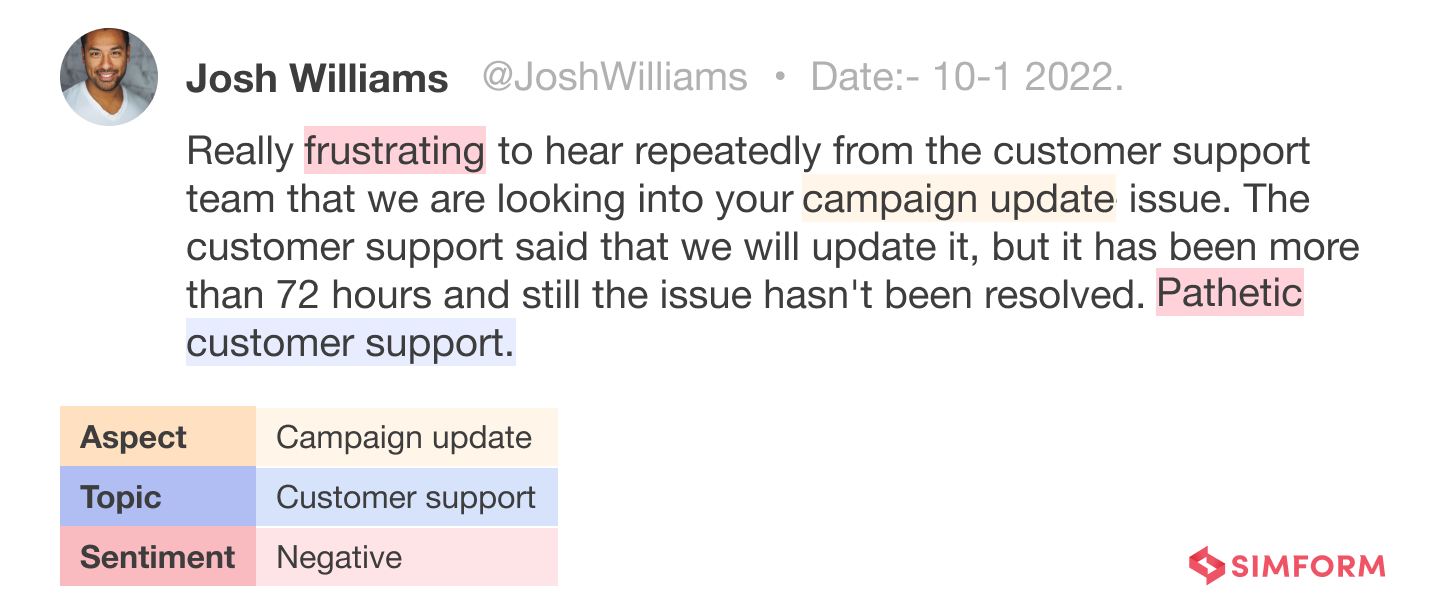
Here is an example of a customer complaining about a brand on social media.
Acquire new clients
Social media is an effective way to market products and 74% of consumers use it to guide their purchasing decisions. Social media listening helps you expand reach beyond your followers. Hilton Hotels, for example, monitors queries like “Where should I go on vacation?” and offers helpful advice through their @HiltonSuggests program.
Through years of social listening, Hilton’s marketing department compiled a list of words and phrases people use when excited about a trip and uses it to create meaningful interactions and promote their brand.
Monitor Brand Perception
Sentiment analysis classifies conversations as favorable, negative, or neutral, which helps prevent PR disasters and crises.
It means, you can avoid unpleasant conversations from developing into major catastrophes by recognizing it when they occur.
For instance, here is a chart depicting the brand perception of a TV show, Game of Thrones.
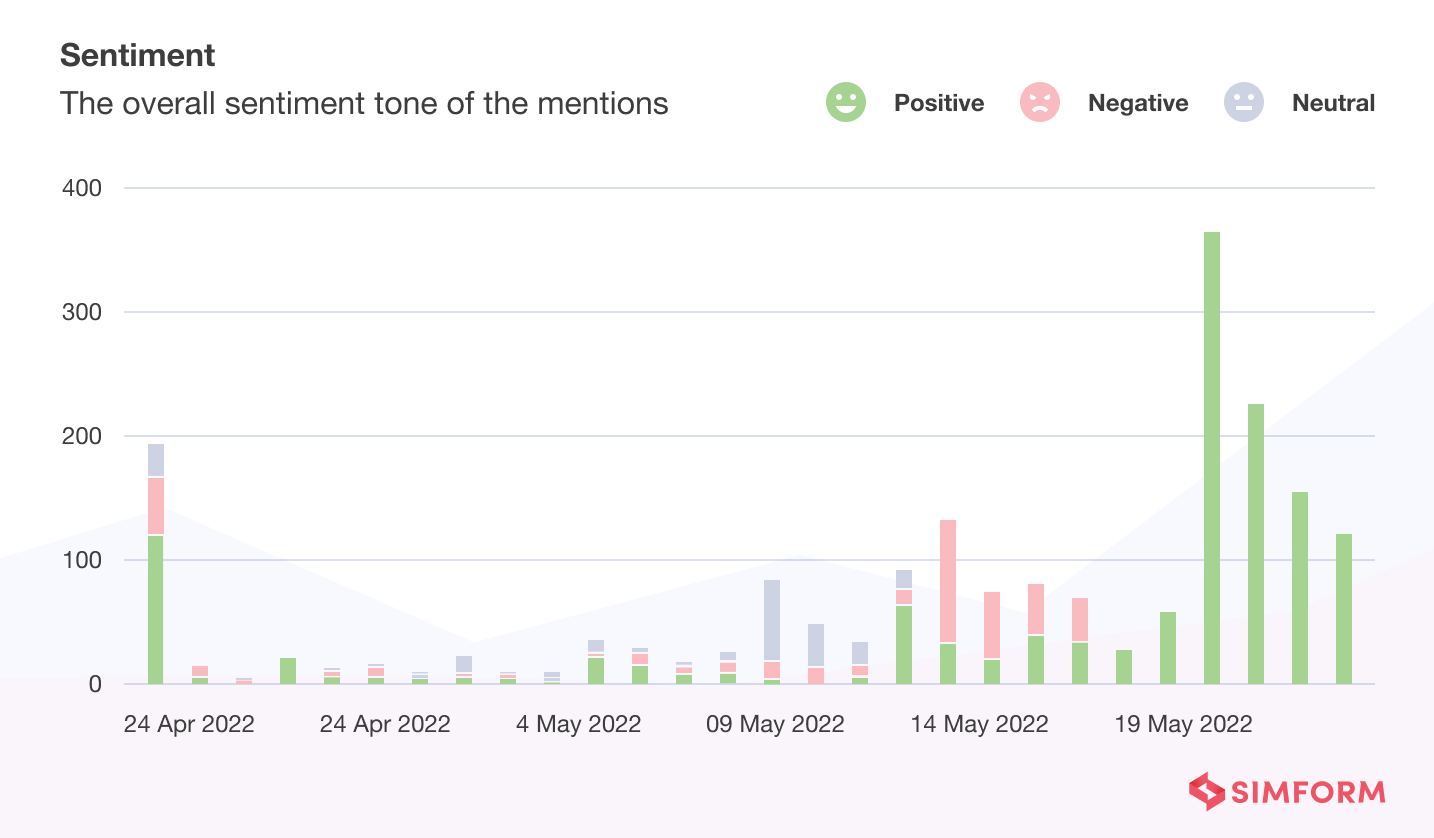
As we can see by monitoring the perceptions, the brand improved the number of positive brand mentions on social media.
After all, brand image has the potential to either increase audience base or have the opposite effect.
So, when you have access to your online sentiment research information, you are well-equipped to influence conversations in favor of your brand.
Let’s see how you can do that by building a social media data analytics pipeline.
How to build a social media analytics pipeline
Building a Twitter sentiment analytics pipeline
Although there were reports of app crashes and buffering streams, the FIFA world cup 2022 was a huge success. It generated $7.5 billion for FIFA. Let’s examine its Twitter data and determine how the general public felt about specific news events, such as “Argentina wins the Fifa world cup.”
Fundamental Building Blocks of the System
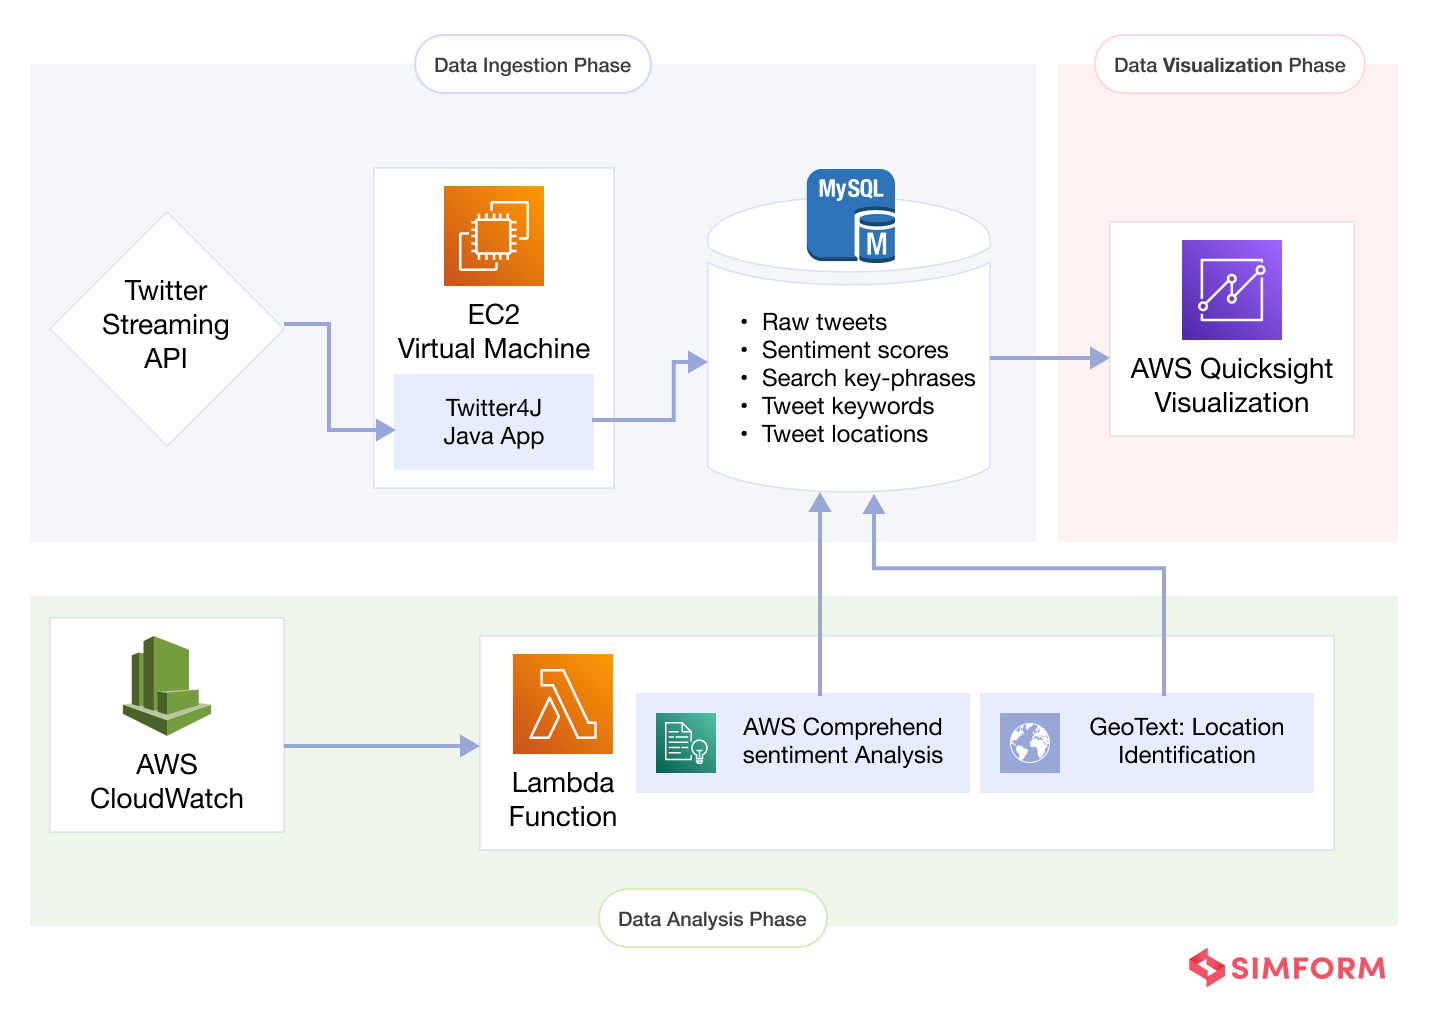
Our social media analytics pipeline comprises a variety of platforms and relies heavily on the cloud infrastructure provided by Amazon Web Services (AWS). This is done in order to determine how the general public feels about the recent news occurrence. Our system processes the data through the following three stages in order to get useful insights from recently released Tweets:
- An initial step of data ingestion
- Analysis phase
- Data visualization phase
Data Ingestion
The Java application connects to the Twitter Streaming API to collect real-time tweets using the Twitter4j library. It interfaces with a MySQL relational database using the JDBC library and saves the tweets in the database as soon as they are published. The program continuously ingests tweets by hosting them on an AWS Linux EC2 machine. It also gathers tweets that match a set of selected relevant keywords for sentiment analysis, aside from tweets containing the phrase “Argentina wins the Fifa world cup.”
Data Analysis
The AWS CloudWatch service initiates a serverless Lambda function on regular time intervals to filter and analyze English tweets for positive, negative, neutral, and mixed sentiment. The Lambda function reads unprocessed tweets from the MySQL database and performs sentiment analysis and keyword extraction with AWS Comprehend and location matching using the Python geotext package.
Data Visualization
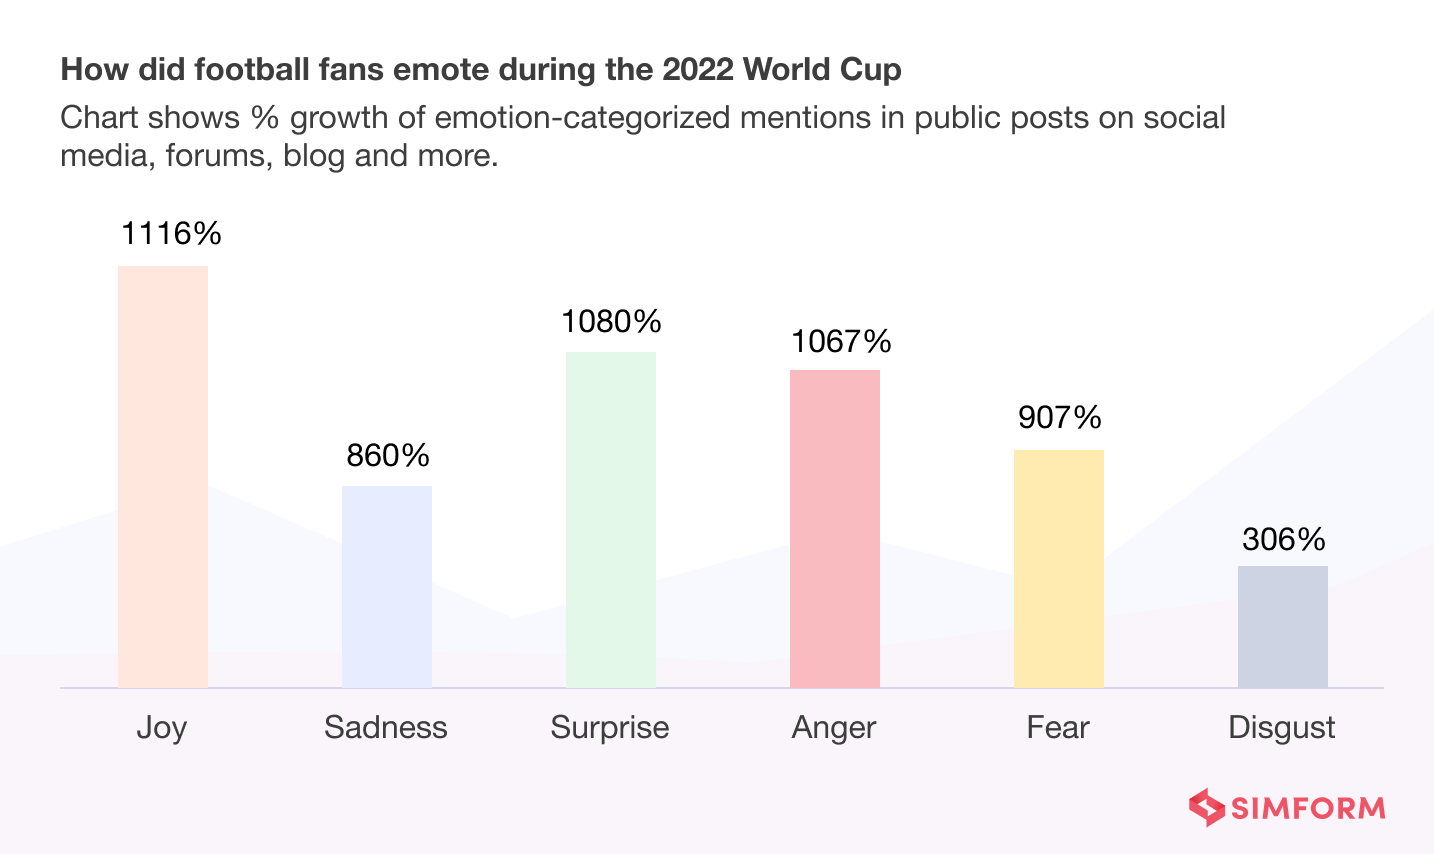
AWS QuickSight creates a dashboard that displays data visualization analytics about the breakdown of tweet sentiments, most prevalent terms and user regions. It continually updates the data to give users a real-time experience. The table shows a breakdown of how people feel about various topics (e.g., Joy, Hate, Conspiracy). These findings indicate the general feeling about certain issues discussed on Twitter. We plan to use them as a foundation for developing more advanced topic-modeling strategies in the future. The next section provides an example of the daily breakdown of emotion.
Below are some images of the kind of final results that you can expect. Note that this isn’t actual data, the images are just for showing the kind of data visualization that you can expect.
 The following image shows the Twitter mentions of every semi-finalist in the FIFA world cup 2022.

A word cloud showing the most popular topics.

Before we move onto the another way of building Twitter pipeline, here’s a short overview of a Twitter sentiment analysis pipeline along with data retrieval mechanism that we built for one of our clients.
Our team crafted a centralized digital hub, expertly designed to collect and organize the insights of leading voices in healthcare and the life sciences. Sifting through 25,000 sources, our platform efficiently curated the most valuable perspectives, presented them in a distilled and easily digestible format, offered valuable reports that cut to the core of the matter. Read the case study to know more.
Twitter analytics case study
Moving forward to building another Twitter data pipeline. As you can see, in this pipeline, we have used different tools like Amazon Redshift, AWS Glue, and Tableau to achieve the same outcome.

The data pipeline for streaming Twitter data comprises the following processes.
- Extract tweets that include particular keywords using the Twitter API and put these tweets into the Kinesis firehose deployed on AWS EC2.
- Create an S3 bucket for storing processed data.
Set up an Amazon Redshift cluster. - Configure AWS Glue to continuously ingest data from Kinesis.
- Connect Tableau to Amazon Redshift as a data source and see the graphical representation of data.
Social media data analysis is just one of the many use cases of data engineering pipelines. Billion-dollar companies like Netflix and Samsung have deployed data pipelines to achieve their goals. Want to know how? Find out in this EXPERT-BACKED EBOOK.
Building Enterprise Data Pipeline: How Billion-Dollar Companies Leverage AWS Data Engineering Tools
Till now, we have seen simple data pipelines. Now let’s look at a comprehensive data pipeline that uses an array of AWS tools to provide more sophisticated sentiment analysis.
Building a Reddit sentiment analytics pipeline
The following pipeline can help companies understand and analyze customers’ sentiments on Reddit towards their brand. Using pre-trained machine learning models from Amazon Comprehend, Amazon Translate, and Amazon Rekognition allows the pipeline to perform a plethora of tasks. Some of these include topic modeling, semantic search, and image analysis. These tasks help companies understand the context and nature of online interactions and identify potential threats. In addition, the visual dashboard provides a convenient way to quickly understand the analysis results and find insights in nearly real-time.
Architecture diagram
The following is the architecture diagram of the Reddit sentiment analysis pipeline.
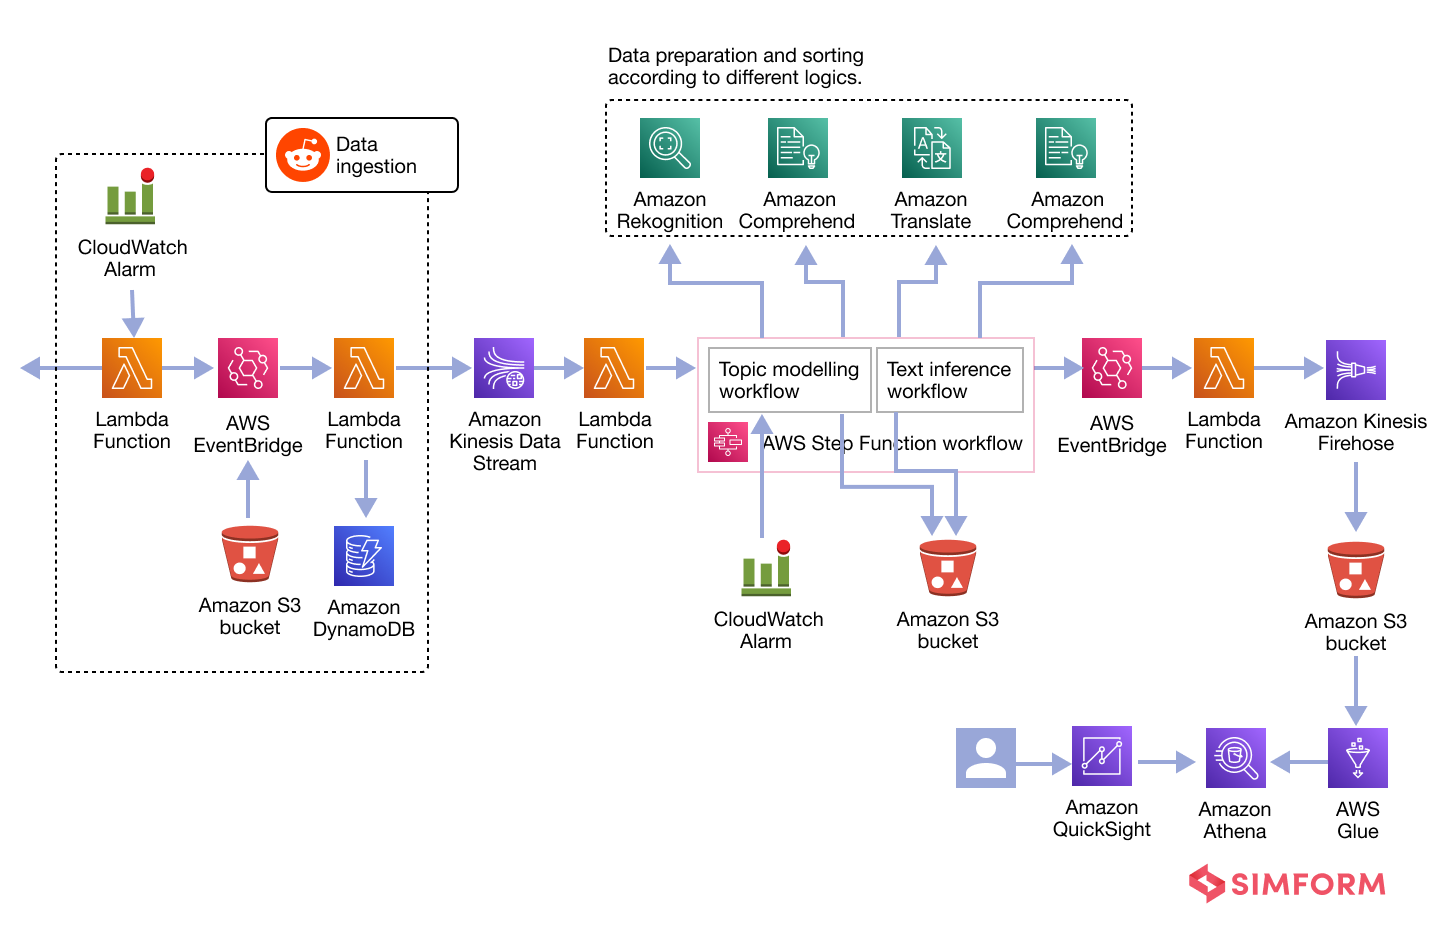
Go with the AWS CloudFormation template because it will automatically deploy the following resources to your account.
- AWS Lambda functions
- Amazon Simple Storage Service (Amazon S3) buckets
- Amazon Kinesis Data Streams
- Amazon Simple Queue Service (Amazon SQS) dead-letter queue (DLQ)
- Amazon Kinesis Data Firehose
- AWS Step Functions workflows
- Amazon Glue tables
- Amazon QuickSight
Workflow of the Reddit Data Analytics Pipeline
The following essential components and workflows are included in the architecture of the solution:
Data Ingestion
This solution deploys a CloudFormation template to automate the process of data ingestion from Reddit (comments from subreddits of interest). The following is the reference architecture for Reddit comments ingestion using an Amazon S3 bucket.
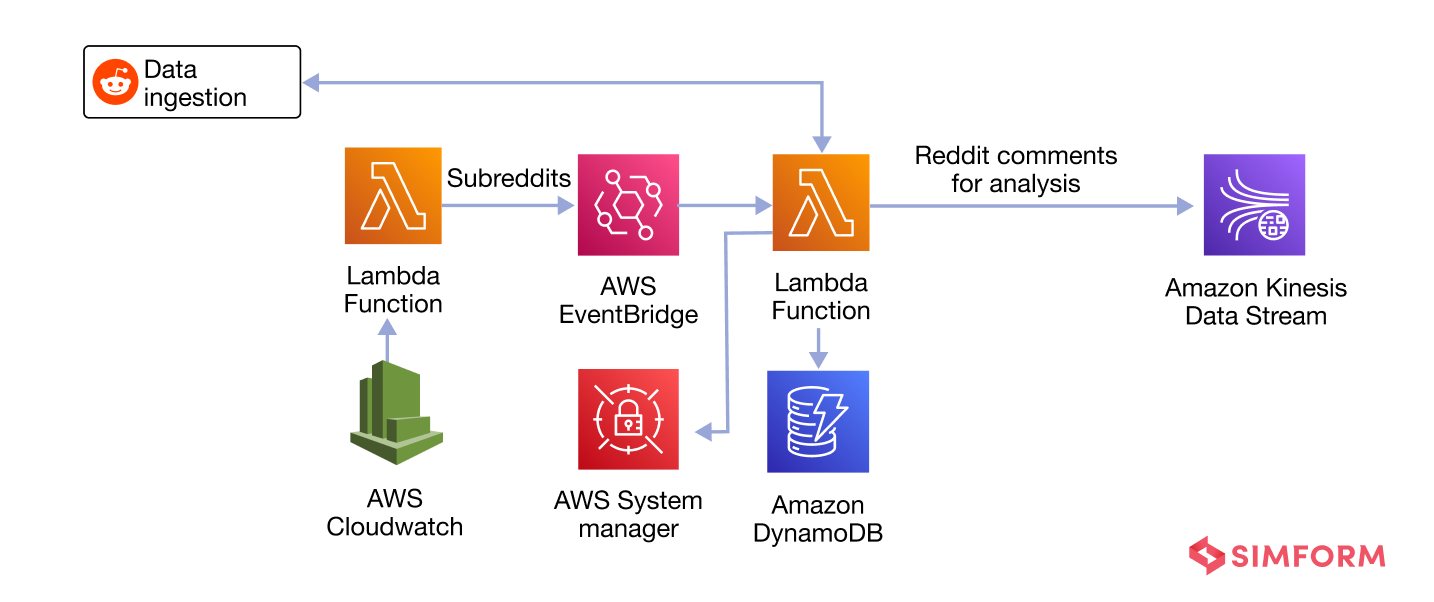
When the CloudFormation template for this solution is launched, the resources necessary for the ingestion adapters are built and deployed depending on the selections made during that process.
Data streaming
The data is buffered using Amazon Kinesis Data Streams. We do this to ensure the throttling of incoming requests as and when required.
The Data Streams are equipped with a DLQ that can detect and correct any processing issues that may occur with the feeds.
A Step Functions workflow is initiated by a Workflow Consumer (Lambda function) of the Data Streams. This workflow orchestrates Amazon Machine Learning features such as Amazon Translate, Amazon Comprehend, and Amazon Rekognition.
Data Integration
An event-driven architecture that makes use of Amazon EventBridge is used to combine the inference data with the storage components of the system. In addition, EventBridge enables more customization by allowing users to configure rules to add other targets.
Data visualization
In this stage, we are essentially combining resources from Amazon Kinesis Data Firehose, Amazon S3 buckets, AWS Glue tables, Amazon Athena, and Amazon QuickSight.
The AWS Well-Architected Framework and the AWS Well-Architected Pillars of Operational Excellence, Security, Reliability, Performance Efficiency, and Cost Optimization are utilized during the construction of these individual components, which guarantees a secure, high-performing, resilient, and cost-effective infrastructure.
A retail coffee brand implemented this complex pipeline. Here’s the output of the same.
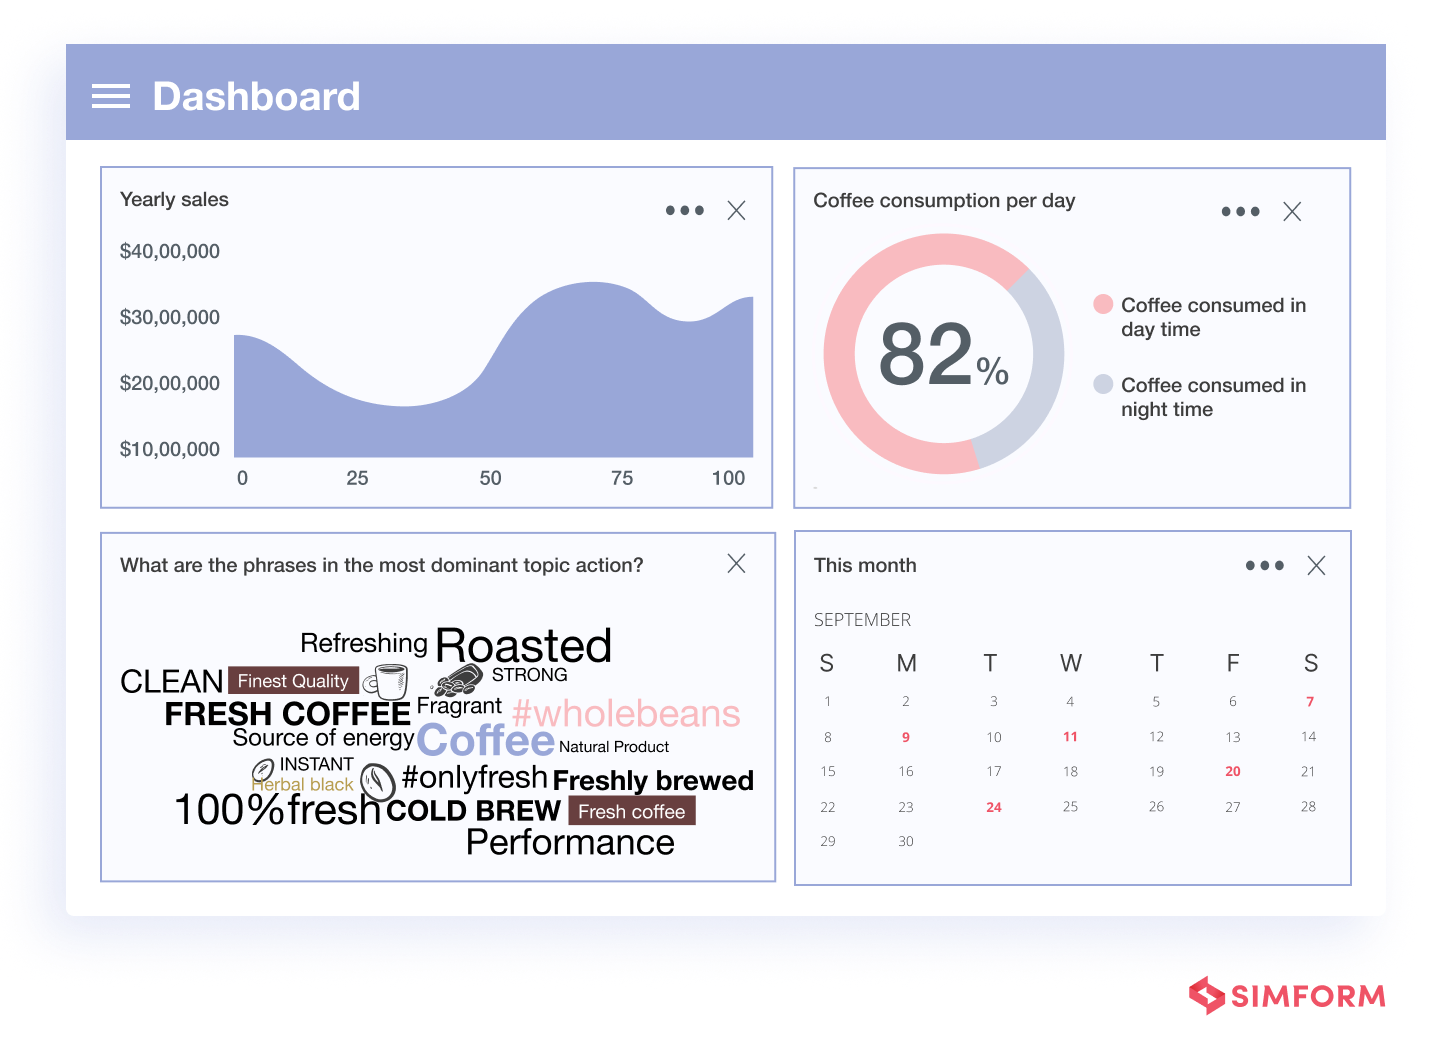
This solution has the following traits that help make it an effective data engineering solution.
In-built Observability
AWS CloudFormation builds the template without hard-coding resource names or Regions, enabling you to replicate the solution in any Region where the necessary services are available. Amazon CloudWatch Logs for Lambda functions and the monitoring features provided by services like Step Functions, Kinesis Data Streams, and Kinesis Data Firehose provide observability into the infrastructure. Integrating AWS Systems Manager and Application Manager into the solution helps investigate and remediate issues with the AWS resources used by the solution.
Robust Security
This approach encrypts data both while it is at rest and while it is being moved around. Amazon S3 buckets and DynamoDB tables use the SSE-S3 AWS-managed encryption service to encrypt data while it is stored. In addition, all endpoints for AWS Cloud services use HTTPS endpoints, and AWS-managed encryption is enabled for Kinesis Data Streams. This ensures that data is encrypted while it is in transit. The solution’s default implementation consumes many different sorts of data, including the public information available through social networking platforms.
On the other hand, it does not automatically redact data that contains personally identifiable information (PII). Therefore, when the solution is extended for use cases that involve processing personally identifiable information (PII), we recommend using Amazon Macie to detect any PII and Amazon Comprehend to redact any personal information before processing it through the workflow provided by the solution. In addition, the AWS Identity and Access Management (IAM) role policies govern the interactions between the many services that make up this solution. The policies are set up according to the notion of having the fewest possible privileges.
It is highly recommended that you update the refresh token for the Reddit API to align with your password rotation strategy. This will ensure the security of your Reddit account, as the platform allows for revoking the current token and generating a new one. Please consider this action to protect your account.
Highly reliable system
Lambda, Amazon Rekognition, Amazon Translate, Amazon Comprehend, and DynamoDB are the AWS serverless artificial intelligence (AI), computation, and storage services that form the foundation of this solution. These services ensure that the solution is highly available and reliable. To reduce the likelihood of throttling issues caused by burst workloads, the workflow activities are supported via an SQS-based asynchronous call-back service interaction mechanism. In addition, the solution makes use of the Dead Letter Queue, often known as DLQ, as an option to route failed events and provide you the ability to troubleshoot and fix underlying problems.
Better performance
This solution uses Lambda functions to offer concurrency and scaling, which guarantees the effective utilization of available computing resources.
It takes advantage of DynamoDB to provide greater throughput(with a latency of less than a millisecond) and robustness by auto-scaling and on-demand scaling. The data buffering provided by Kinesis Data Streams helps the architecture remain stable in the face of sudden data spikes and data bursts. To improve the effectiveness of queries used for reporting, the data is kept in a columnar format and is partitioned.
Look for a data engineering partner
Sentiment analytics can help businesses like yours stay ahead of the competition and make data-driven decisions to improve their bottom line. But to tap into the power of this game-changing strategy, you will need a reliable data engineering partner to build a robust pipeline.
That’s where Simform comes in! With our data engineering services, you can develop an effective sentiment analytics pipeline with real-time data insights. Our pipeline makes it easy to extract, clean, and process large volumes of data from different social media platforms, making it easy to analyze and interpret.
Unlock the full potential of the social media sentiment analysis pipeline and improve your customer service and retention. Contact our solutions architects today and realize the power of data engineering!